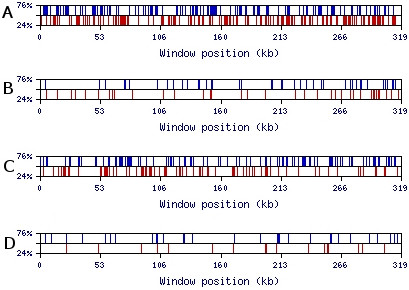
Figure 6.

Visualization of MRI-analyzeroutput for AG- and GT-compositions of 319 kb sequence of the first intron of the DMD gene using a 50 nt window. Upper and lower thresholds are specified on the y-axis as a percentage of the window size. (A) AG-rich and AG-poor regions of the DMD intron; (B) AG-rich and AG-poor regions of the corresponding random SRI-generated set based on the tetramer oligonucleotide frequency table of the DMD intron; (C) GT-rich and GT-poor regions of the DMD intron; (D) GT-rich and GT-poor regions of the corresponding random SRI-generated set based on the tetramer oligonucleotide frequency table of the DMD intron.
