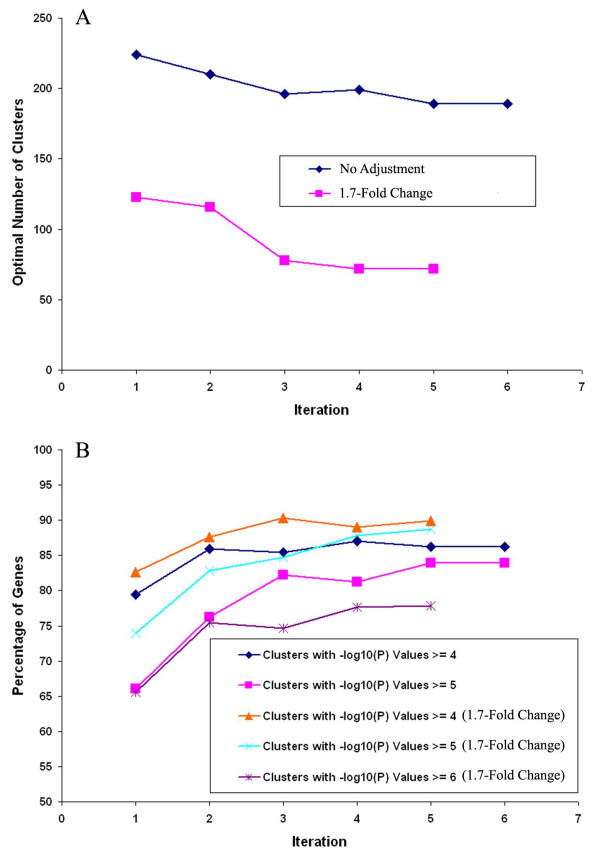
Figure 2.
Results of iterative clustering with dataset II. A. Number of clusters as a function of the number of iterations of clustering dataset II with a p-value cutoff of 10-4, either including all 5657 genes in the Dataset (No Noise Adjustment) or including only those 4346 genes that exhibit a 1.7 fold change for at least 10% of the time points (1.7-Fold Change Noise Adjusted). B. Percent of genes residing in biologically coherent clusters as a function of iteration cycle. Data are shown for percent of clusters with a minimum of biological coherence of p-value less than 10-4 and 10-5 for all genes in the dataset and for a biological coherence of p-value less than 10-4, 10-5 and 10-6 for the subset of genes that exhibit a 1.7 fold change for at least 10% of the time points (minimal fold-change for meaningful clustering).

