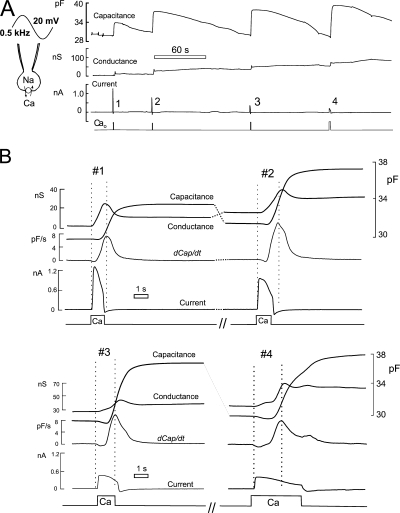
Figure 1.
Typical records of membrane capacitance, conductance, and current from BHK cells consitutively expressing the cardiac Na/Ca exchanger (NCX1). Cell parameters are monitored via 20-mV sinusoidal membrane voltage perturbation at 0.5 kHz. Input resistance ≈ 1 MΩ. Cytoplasmic solution contains 40 mM Na and 0.5 mM EGTA with 0.25 mM Ca (free Ca, 0.4 μM). Exchange current was activated four times for increasing durations of 1–6 s by applying and removing 2 mM extracellular Ca, as indicated below the records. (A) Complete signal records. (B) Expanded signal records for the time periods during and immediately after activation of exchange current. dCap/dt is the first derivative of capacitance. Two vertical dotted lines in each activation cycle mark the time when current was activated and the time at which the maximal rate of rise of capacitance occurred. Note that the rise of capacitance is preceded by a small negative capacitance phase. The time from current activation to peak rate of rise of capacitance increases as the peak exchange current decreases in this sequence.

