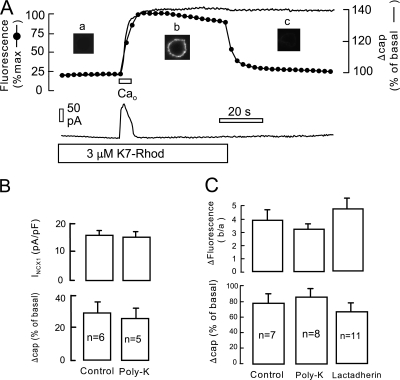
Figure 12.
Extracellular cell surface accumulation of K7-Rhod (3 μM) upon activating maximal Ca influx in an NCX1-expressing BHK cell. (A) Cell membrane fluorescence and whole cell capacitance changes during and after application of 2 mM Ca for 5 s. Both the control and the Ca-containing solutions contain K7-Rhod. Fluorescence increases with nearly the same time course as membrane capacitance, and the K7-Rhod probe washes off the cell rapidly 45 s after activating Ca influx. Note that the background fluorescence of the light intensities given in the graph (∼20%) represents the homogeneous fluorescence of K7-Rhod throughout the solution. (B) Average peak exchange currents and membrane capacitance changes in response to 5 s application of Ca for six control cells and six cells perfused with 20 μM 2000 MW polylysine. Results are not significantly different. (C) Fluorescence and membrane capacitance changes, determined as in A, for 7 control cells, 8 cells perfused with 20 μM 2000 MW polylysine, and 11 cells perfused with 0.2 μM lactadherin.

