Figure 4.
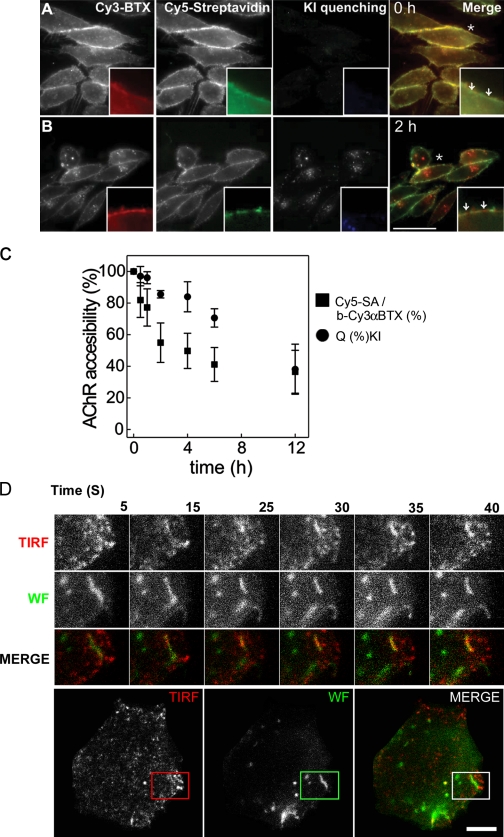
Kinetics of AChR sequestration and internalization into surface-accessible tubular structures. (A and B) CHO-K1/A5 cells were labeled at 4°C with b-Cy3αBTX for 1 h and subsequently incubated with Cy5-SA at 4°C for 1 h either before (A) or after a chase at 37°C for 2 h (B). Fluorescence images of Cy5-SA (green) and b-Cy3αBTX before (red) or immediately after quenching surface fluorescence with KI (blue). The arrows in the inset in A show the overlapping labeling of membrane with both b-Cy3αBTX and Cy5-SA before chase. The arrows in the inset in B indicate regions of the membrane that were labeled with b-Cy3αBTX that could be quenched with KI but were not accessible to Cy5-SA. Asterisks in both A and B indicate the regions of the cells that were magnified 2.5 times in the insets. (C) Graph showing quantitative estimate of the accessibility of the receptors labeled with b-Cy3αBTX at 4°C for 1 h and subsequently incubated at 37°C for the indicated times before assessing surface accessibility to Cy5-SA (indicating sequestration) or KI quenching (indicating internalization). Cy5/Cy3 fluorescence intensity ratio (squares) was calculated on a per cell basis, normalized to that at t = 0 h, and plotted against time. The extent of internalization was determined by measuring the extent of KI quenching. Cy3αBTX-labeled cells incubated for the indicated times at 37°C were imaged before and after quenching with KI, and percentage of quenching per cell (circles) was calculated (see Materials and methods). Each data point is from a minimum of 60 cells in a single experiment and represents weighted mean and errors from the mean obtained from at least three independent experiments. Error bars represent SEM. (D) TIRF imaging confirms the presence of AChR in membrane-proximal tubules before late endosomal delivery. Cells labeled with AlexaFluor488-αBTX on ice were chased at 37°C for 2 h and imaged live using TIRF microscopy. Montages from a video (Video 1, available at http://www.jcb.org/cgi/content/full/jcb.200709086/DC1) of TIRF images in the top-most panels (middle panels show their wide-field counterpart, and bottom ones are pseudocolored merge images of the wide-field [green] and TIRF [red] images) depict αBTX-labeled tubular structures close to the cell surface. The montage of insets are a magnified time-lapse sequence from a region outlined in the cell depicted in the bottom panels, where red and green outlined boxes represent αBTX distribution in TIRF and wide field, respectively. Bars: (A and B) 50 μm; (D) 10 μm.

