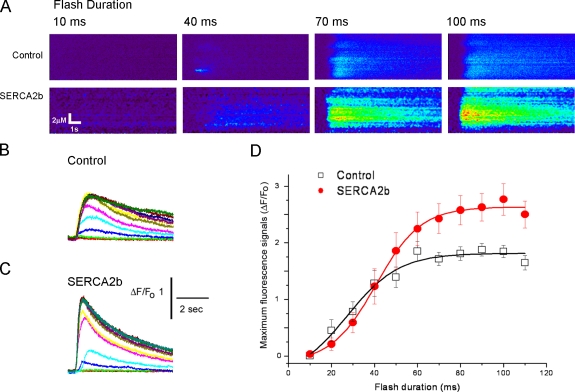
Figure 6.
Overexpression of SERCA2b phenocopies the enhanced IP3-evoked signals and accelerated Ca2+ decay observed with presenilin overexpression. (A) Representative linescan images showing Ca2+ signals evoked by photolysis flashes of 10-, 40-, 70-, and 100-ms durations. In each panel, distance along the scan line is depicted vertically, time runs from left to right, and increasing fluorescence ratio (increasing Ca2+) corresponds to increasingly “warm” colors. Note the enhanced response in the oocyte overexpressing SERCA2b. (B and C) B and C show, respectively, Ca2+-dependent fluorescence signals evoked by photoreleased IP3 in a control oocyte and an oocyte expressing SERCA2b. In each panel, superimposed traces show responses (fluorescence ratio change averaged across the scan line) evoked by UV light flash durations in 10-ms increments between 10 and 110 ms. (D) Mean peak Ca2+ concentration plotted as a function of flash duration (linearly proportional to IP3) in control oocytes (n = 6) and in oocytes expressing SERCA2b (n = 5) from at least six recordings from multiple oocytes. Error bars show SEM.

