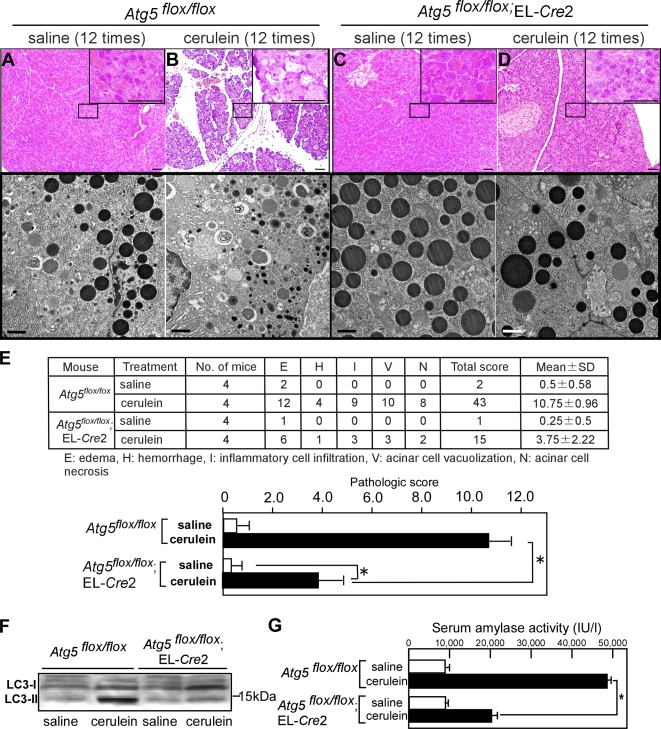
Figure 4.
Absence of cerulein-induced acute pancreatitis in acinar cell–specific Atg5-deficient mice. Atg5flox/flox (A and B) or Atg5flox/flox;EL-Cre2 (C and D) mice were injected with saline or cerulein 12 times, and pancreatic sections were analyzed by H&E staining (A and C) and EM analysis (B and D). Insets show higher magnifications of areas indicated in A–D. EM analysis demonstrating the absence of autophagy in Atg5flox/flox;EL-Cre2 mice. (E) Histological changes were quantified using a histological score by a pathologist. There was statistically significant difference in pathological changes between Atg5flox/flox and Atg5flox/flox;EL-Cre2 mice. Unpaired t tests were used to calculate p-values. P < 0.05 was considered a significant difference. (F) Increase of LC3-II in Atg5flox/flox but not in Atg5flox/flox;EL-Cre2 after cerulein treatment. (G) Serum amylase activity in cerulein-induced acute pancreatitis. Open bars, saline injection (n = 4); black bars, cerulein injection (n = 4). The asterisk indicates the statistical difference between amylase levels in Atg5flox/flox and Atg5flox/flox;EL-Cre2 mice (*, P < 0.05). Error bars represent SEM. Bars: (A and C) 50 μm; (B and D) 2 μm.

