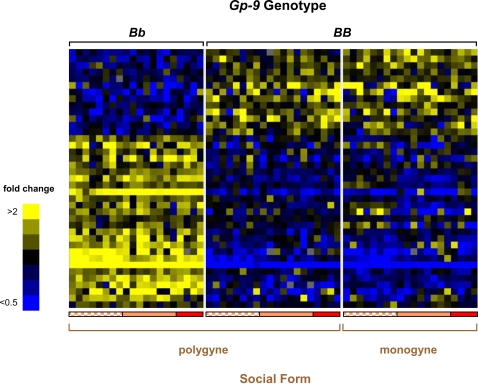
Figure 1. Expression profiles between S. invicta adult workers with the BB and Bb genotypes of Gp-9.
Expression profiles for 39 differentially expressed genes are depicted (ANOVA, 10% false discovery rate [FDR]). Each row represents data for one gene, and each column represents data for a pool of 7–10 nestmates with the same Gp-9 genotype sampled from each of twenty colonies of each social form. Colonies were collected from Georgia (2004, checkered peach bar; 2006, solid peach bar) and Louisiana (2006, solid red bar), USA (data from each polygyne colony are presented in the identical order for the alternate genotype groupings). Expression levels for each gene are depicted relative to the average level across all experimental samples (blue, low levels; yellow, high levels). Genes are arranged by hierarchical clustering. See Text S1 and Table S1 for confirmation of selected gene expression results with quantitative RT-PCR (qRT-PCR).

