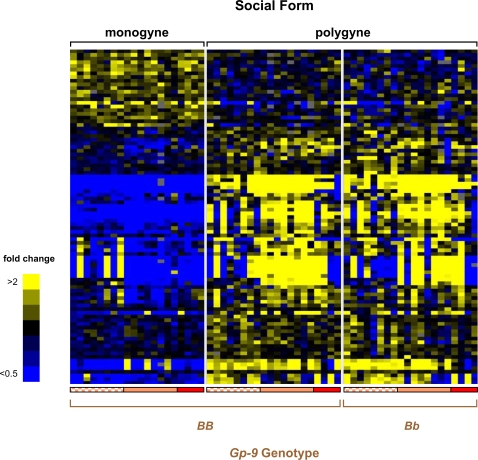
Figure 2. Expression profiles between S. invicta adult workers from monogyne and polygyne colonies.
Expression profiles for 91 differentially expressed genes are depicted (ANOVA, 10% FDR). Rows and columns represent data as described in the Figure 1 caption. See Text S1 and Table S1 for confirmation of selected gene expression results with qRT-PCR.

