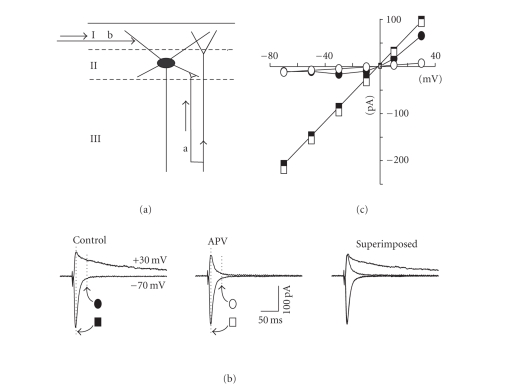
Figure 1.
Properties of evoked EPSCs in EC layer II neurons. (a) Schematic diagram of the ascending columnar (arrow a) and the horizontal (arrow b) inputs converging on a layer II cell in entorhinal cortex (I, II, and III refer to the superficial layers of the EC). (b) Stimulation of layer III evoked excitatory postsynaptic currents that had different profiles at hyperpolarized (−70 mV) versus depolarized (+30 mV) potentials and sensitivity to APV. For these experiments, 130 mM CsGluconate and 0.8 mM QX314-Cl were substituted for KGluconate in the recording pipette. Corrections were made for the liquid junction potential. In control conditions (leftmost panel), EPSCs demonstrated only a fast decay component at −70 mV, but showed a slower decay component at +30 mV. In the presence of 50 μM DL-APV (middle panel), only the fast component was observed at both holding potentials (a direct comparison is shown in the superimposed traces in the rightmost panel). (c) I-V relationship for EPSC components measured at peak and 30 milliseconds post peak for the same cell (see dotted lines in (b)). The peak amplitude (closed square plots) showed a linear relationship across the full range of membrane potentials tested (−70 to +30 mV). This was unchanged following application of APV (open square plots). In control conditions, the amplitude measured 30 milliseconds following the peak (filled circles) was lower and showed a negative slope region at depolarized membrane potentials levels (−60 to −20 mV) but became nearly linear thereafter. In the presence of APV (open circles), the negative slope region was abolished and the resultant plot was linear across the full range of membrane potentials.

