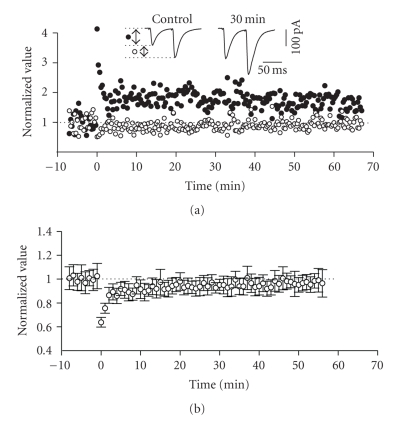
Figure 10.
Expression of LTP in the ascending pathway was associated with a slight change in PPF ratio. (a) Normalized scaled amplitude of the peak EPSCs evoked by the first of a pair of test pulses separated by 60 milliseconds (filled circles), and the normalized PPF ratio (open circles) in a layer II cell is plotted against time. The inset shows two traces reflecting averaged paired EPSCs at baseline (pre-HFS) and at 30 minutes post-HFS. PPF ratio was calculated as the amplitude of the peak of the second EPSC divided by the first. (b) Average normalized scaled amplitude of PPF ratio in 8 cells. HFS at time zero induced a short-term decrease of PPF which decayed back to near baseline levels. The values at 30 and 50 minutes after HFS, however, (0.917 ± 0.084 and 0.938 ± 0.062, resp.) were significantly different from baseline (P < .01).

