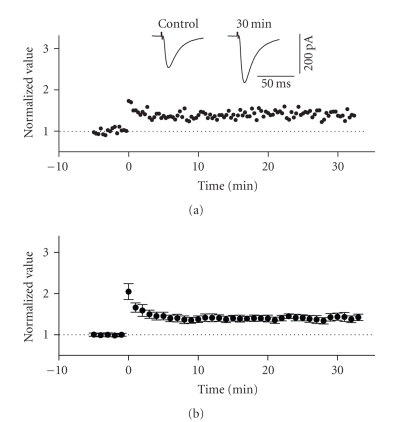
Figure 3.
LTP in the horizontal associative pathway of the superficial entorhinal cortex. The stimulation electrode was positioned on the surface of layer I, lateral to the recording electrode. (a) Normalized scaled amplitude of peak EPSCs evoked by test pulses in a layer II cell is plotted against time. HFS at time zero led to an immediate and long-lasting potentiation of EPSCs. The inset shows two traces reflecting averaged EPSCs at baseline (pre-HFS) and at 30 minutes post-HFS. (b) Average normalized scaled amplitude of peak EPSCs across 15 cells. The value at 30 minutes post-HFS (1.401 ± 0.087) is significantly different from baseline (P < .01).

