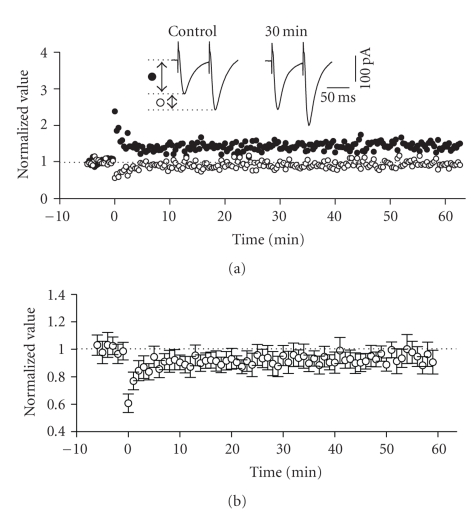
Figure 6.
Expression of LTP in the horizontal pathway was associated with a slight change in paired-pulse facilitation (PPF) ratio. (a) Normalized scaled amplitude of the peak EPSCs evoked by the first of a pair of test pulses separated by 60 milliseconds (filled circles) and the normalized paired pulse facilitation ratio (open circles) in a layer II cell is plotted against time. The inset shows two traces reflecting averaged paired EPSCs at baseline (pre-HFS) and at 30 minutes post-HFS. PPF ratio was calculated as the amplitude of the peak of the second EPSC divided by the first. (b) Average normalized scaled amplitude of PPF ratio in 10 cells. HFS at time zero induced a short-term decrease which decayed back to near baseline levels. The values at 30 and 50 minutes after HFS, however, (0.944 ± 0.065 and 0.966 ± 0.068, resp.) were significantly different from baseline (P < .01).

