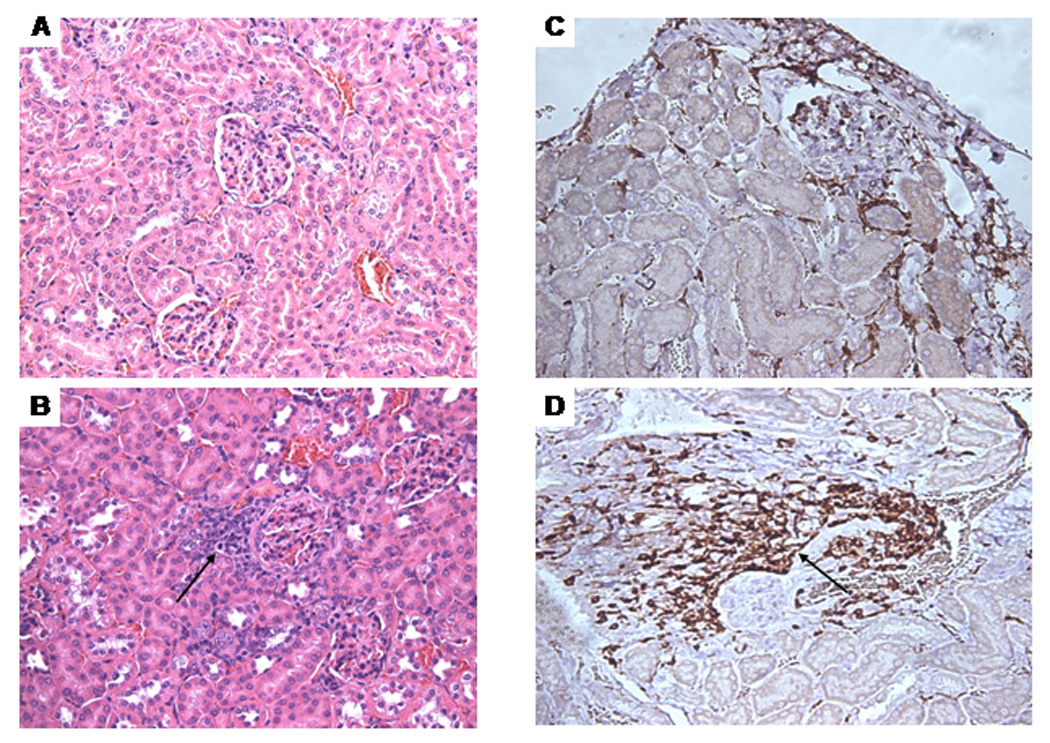
Figure 5.

Morphological changes in the kidneys of MRL +/+ mice treated with TCE for 48 weeks. A. Control, H&E stain. B. TCE-treated: the arrow indicates perivascular inflammatory infiltrates. C. Control, CD3-stain. D. TCE-treated: the arrow indicates CD3-positive lymphocytes (A–D, x200).
