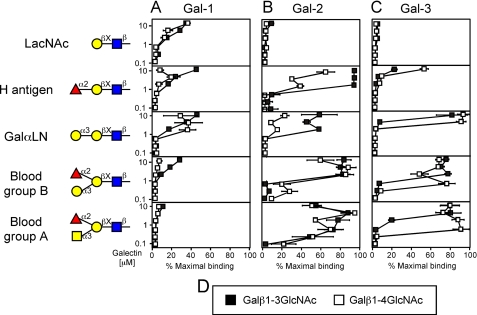
FIGURE 2.
Gal-1, Gal-2, and Gal-3 recognition of LacNAc and LacNAc-derivative glycans. Trivial names followed by the structures of each glycan tested are shown. Recognition of each representative glycan is displayed as the percent bound when compared with the highest bound ligand by each respective galectin tested in this study. Glycan recognition is shown for Gal-1 (A), Gal-2 (B), and Gal-3 (C). D, legend for type 1 and type 2 structures. Black squares = type 1 LacNAc, white squares = type 2 LacNAc.

