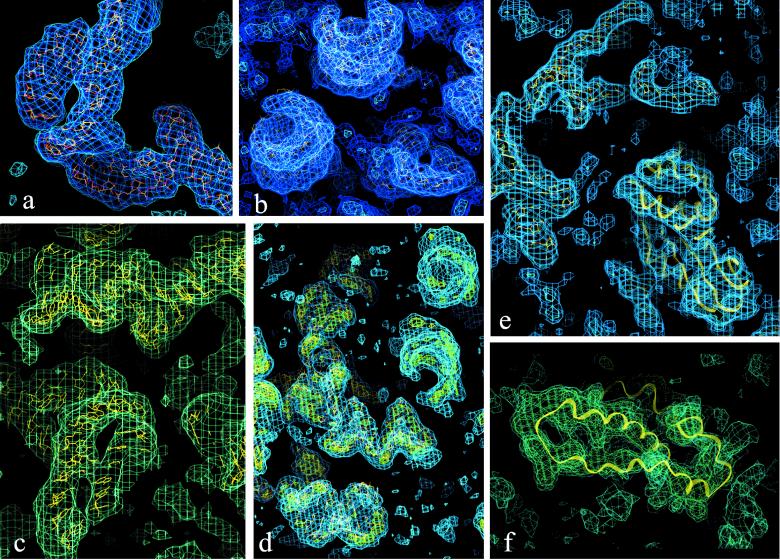
Figure 2.
Parts of the T30S electron density maps at different stages of structure determination from 6 to 4.5 Å (contour level 1 SD, unless otherwise mentioned). (a) A helix-bulge-helix region, traced at 6 Å resolution. (b and c) Views of A-form RNA regions within the 4.5 Å map. (d) Part of the 4.5 Å map, contoured at 1.5 (cyan) and 2.5 (green-yellow) SD. These levels were chosen to avoid background noise and to highlight the phosphates in the RNA backbone, respectively. (e and f) The regions of the 4.5 Å map assigned to protein TS5 and TS15, respectively. In f, the less well defined helix was found to be flexible in isolation by NMR and x-ray (21).

