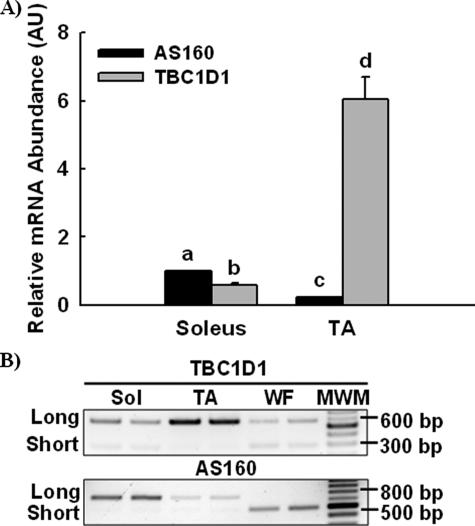
FIGURE 5.
TBC1D1 and AS160 mRNA expression and relative distribution of splice variants. A, relative TBC1D1 and AS160 mRNA abundances were compared by isolating RNA from TA and soleus muscle, reverse transcribing RNA to cDNA, and then amplifying cDNA by real-time PCR. The data are expressed as the means ± S.E. (n = 8). a-d, groups within each panel not sharing a common letter or number are statistically different, p < 0.05. B, relative expression of TBC1D1 and AS160 splice variants within soleus muscle, tibialis anterior muscle, and white fat were compared by isolating RNA, reverse transcribing RNA to cDNA, amplifying TBC1D1 and AS160 cDNA by PCR with splice exon-flanking primers, separating amplicons by agarose gel electrophoresis, and imaging with ethidium bromide staining under ultraviolet light. Replicates produced similar results.

