FIGURE 6.
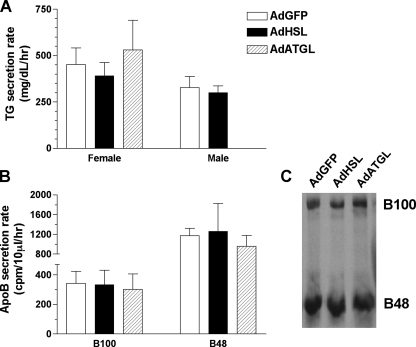
In vivo TG and apoB secretion rates in AdHSL- and AdATGL-infected ob/ob mice. A, TG secretion rates were assessed, using the Triton WR1339 method, in female (left panel) and male (right panel) ob/ob mice 8 and 5 days, respectively, after infection with AdGFP, AdHSL, or AdATGL. Animals were bled at 0 min (pre-injection) and at 60 and 120 min post-injection. TG secretion rates are calculated as the increase in TG between 60- and 120-min time points and expressed in mg/dl/h (±S.D.). B, female ob/ob mice were also injected with 35S-labeled Promix in addition to Triton WR1339. Blood samples from the 60-min and 120-min time points were subjected to SDS-PAGE followed by fluorography. B100 (left panel) and B48 (right panel) secretion rates represent differences in protein counts between 60- and 120-min time points and are expressed in cpm/10 μl/h (means ± S.D.). Representative samples from the 60-min time point are shown in the autoradiogram (C).

