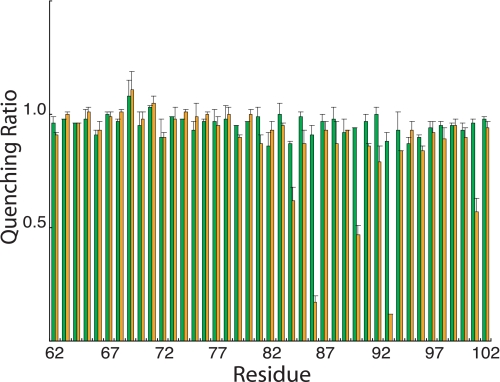
FIGURE 2.
NEM and Ag+ sensitivity of Cys substitutions in the 1–2 loop. Results are presented as the ratios of the quenching response in the presence of Ag+ or NEM to the quenching response in the absence of either reagent. The green bars represent the quenching ratio ±NEM treatment, whereas the orange bars represent the quenching ratio ±Ag+ treatment. Each bar represents the average ratio from n ≥ 2 determinations ±S.D.

