FIGURE 1.
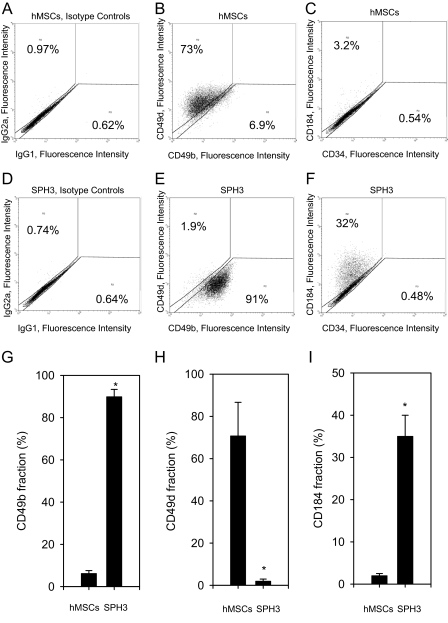
Expression of CD184, CD34, CD49d, and CD49b by cells from a monolayer of hMSCs and hMSC spheroids. Cells were dissociated using trypsin-EDTA for 90 min, stained with IgG2a-PE - IgG1-FITC; CD184-PE - CD34-FITC; and CD49d-PE - CD49b-FITC antibody pairs and analyzed by flow cytometry. Representative two-color fluorescence dot plots are shown. Control stainings with isotype- and fluorochrome-matching antibody pairs are shown in A and D for hMSCs from a monolayer and 3-day-old spheroids (SPH3), accordingly. B and C show dot plots for a monolayer of hMSCs stained with CD49d-PE - CD49b-FITC (B) and CD184-PE - CD34-FITC (C) pairs. Corresponding stainings for cells from SPH3 are shown in E and F. G shows a mean value ± S.D. of a percentage of CD49b-positive cells from a monolayer of hMSCs and SPH3 as an average of three independent experiments. H shows a mean value ± S.D. of a percentage of CD49d-positive cells from a monolayer of hMSCs and SPH3 as an average of three independent experiments. I shows a mean value ± S.D. of a percentage of CD184-positive cells from a monolayer of hMSCs and SPH3 as an average of three independent experiments. To calculate a percentage of positively stained cells data were gated as shown. Statistically significant changes are denoted by asterisks (*, t-test, p value <0.05).

