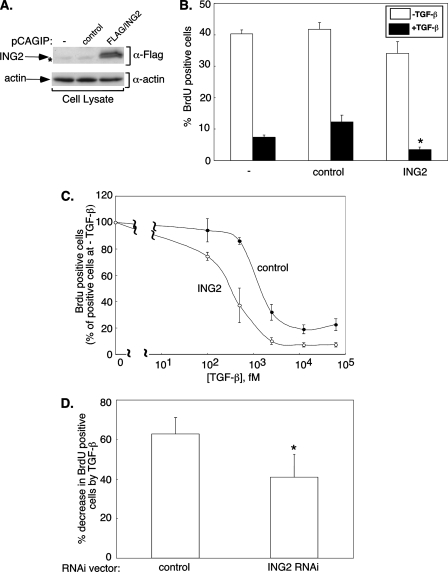
FIGURE 5.
ING2 contributes to TGF-β inhibition of cell proliferation. A, ING2 and actin immunoblotting of lysates of Mv1Lu stable cell lines showing ING2 protein expression. The asterisk indicates nonspecific FLAG-immunoreactive band. B and C, expression of ING2 promotes the ability of TGF-β to inhibit Mv1Lu cell proliferation. B, cells that were untransfected (-), stably expressing the puromycin resistance marker alone (control), or together with a FLAG-tagged ING2 (ING2) were left untreated (-TGF-β) or incubated for 18 h with 62.5 pm TGF-β (+TGF-β). The cells were incubated with BrdUrd-containing medium for 1 h and subjected to indirect immunofluorescence and Hoechst nuclear staining (see “Experimental Procedures”). BrdUrd- and Hoechst-positive cells were imaged and analyzed as outlined under “Experimental Procedures.” The data presented in the bar graph represent the means (±S.E.) of the average of the percent BrdUrd-positive cells from four independent experiments. The asterisk indicates statistically significant difference from the TGF-β-treated untransfected and the resistance marker controls as determined by one-way analysis of variance followed by Student's t test (p ≤ 0.025). C, control or ING2 expressing stable cells were incubated with increasing TGF-β concentrations for 18 h followed by BrdUrd labeling. For each of the control or ING2 expressing cells, the percentage of BrdUrd-positive cells at each TGF-β concentration was expressed relative to that in the absence of TGF-β. The means (±S.E.) of the average values from three independent experiments are plotted on the y axis versus the TGF-β concentration (fM) on the x axis. D, knockdown of endogenous ING2 reduces TGF-β-dependent suppression of cell proliferation. Mv1Lu cells transiently transfected with the control or ING2 RNAi vector were incubated in the absence or presence of 25 pm TGF-β followed by BrdUrd incorporation. BrdUrd and GFP immunolabeling, detection, and analysis were carried out as described under “Experimental Procedures.” For each transfection group, the percentage of decrease in BrdUrd-positive cells by TGF-β treatment was determined by expressing the difference in the percentage of BrdUrd-positive cells in absence and presence of TGF-β relative to the BrdUrd-positive cells in the absence of TGF-β. The data presented in the bar graph represent the means (±S.E.) of the percentage of decrease in BrdUrd-positive cells by TGF-β from four independent experiments. The asterisk indicates a statistically significant decrease from the control as determined by Student's t test (p ≤ 0.025).

