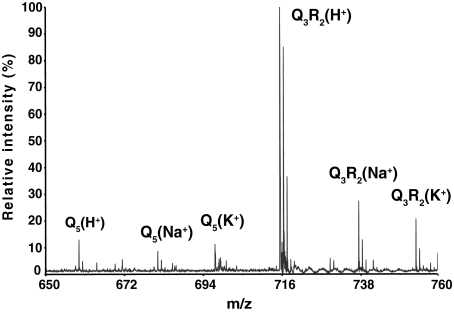
FIGURE 1.
Mass spectrum from an equal molar mixture of Q5 and Q3RR. The synthetic peptides Q5 and Q3RR were quantified by amino acid analysis and mixed at a ratio of 1:1 prior to analysis by MALDI-TOF. The spectrum presented above demonstrates that Q3RR ions are present at much higher levels than those from Q5. Note also that protonated Q3RR ions are more prevalent than sodium or potassium Q3RR ions. By contrast Q5 is almost evenly distributed among the three ionic species.

