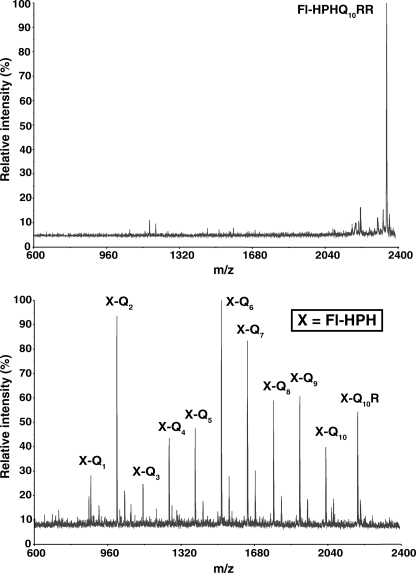
FIGURE 2.
Mass spectra of Fl-HPHQ10RR and its proteasomal degradation products. The upper panel is the mass spectrum of the substrate Fl-HPHQ10RR; the lower panel shows its degradation products after 30 min of incubation with a 20 S proteasome/PA28γ(K188E) mixture as described under “Experimental Procedures.” Most products are present as H+ and K+ adducts.

