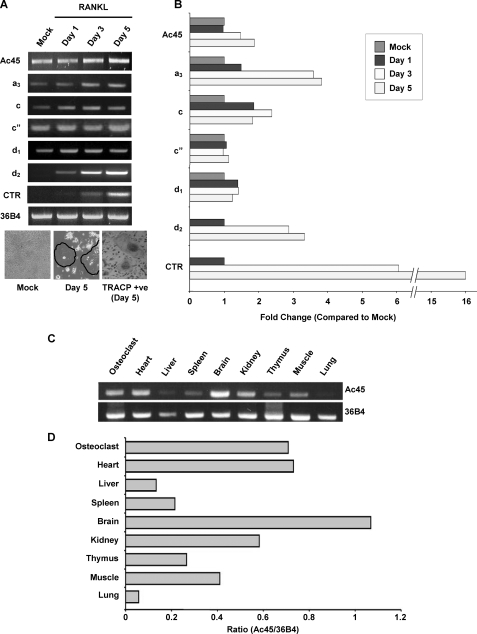
FIGURE 1.
A, different V0 subunits expression profiles during osteoclastogenesis. RAW264.7 cells were treated with RANKL (100 ng/ml) for different time periods (0, 1, 3, and 5 days). RT-PCR analysis was carried out using specific primers to Ac45 and V0 subunits including a3, c, c″, d1, and d2. Calcitonin receptor (CTR) and 36B4 primers were used as control for osteoclastogenesis and house keeping gene, respectively. TRACP staining in a parallel experiment was also included with OCLs highlighted with circles. B, the expression of each subunit relative to 36B4 during osteoclastogenesis was expressed as the fold change over mock. C, RT-PCR analysis of Ac45 (upper panel) and 36B4 (lower panel) in various mouse tissues. D, the relative expression of Ac45 in various tissues relative to 36B4.

