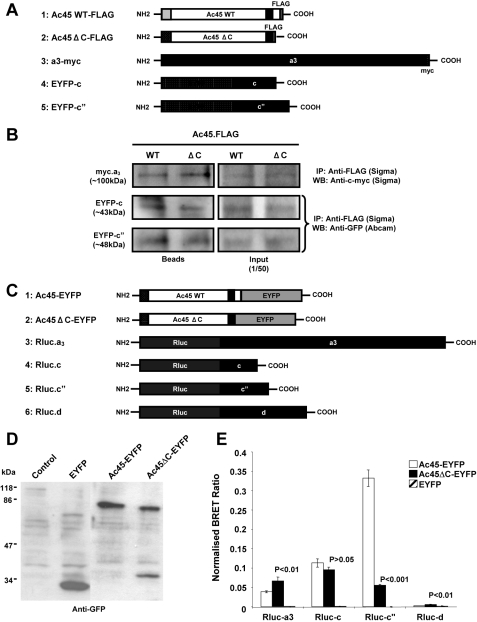
FIGURE 5.
A, schematic representation of Ac45-FLAG, Ac45ΔC-FLAG, a3-cMyc, EYFP-c, and EYFP-c″ constructs used for immunoprecipitation assays. B, immunoprecipitation analysis showing that Ac45 and Ac45ΔC interact with a3, c, and c″, respectively. C, schematic representation of Ac45-EYFP, Ac45ΔC-EYFP, Rluc-a3, Rluc-c, Rluc-c″, and Rluc-d1 constructs used for BRET assays. D, Western blot analysis of COS-7 cells transfected with EYFP, Ac45-EYFP, or Ac45ΔC. Transfected COS-7 cells were lysed in standard sample buffer, and cell lysates (30 μl) were subjected to analysis by SDS-PAGE and immunoblotting with anti-GFP rabbit polyclonal antibody. E, BRET assays showing the levels of interaction of Ac45 with V0 subunits a, c, c″, and d1. COS-7 cells co-expressing Ac45-EYFP or Ac45ΔC-EYFP and either Rluc tagged a3, c, c″, or d1 subunits were assayed following the addition of coelenterazine and the BRET ratio relative to the Rluc alone expressing cells determined (normalized BRET ratio). Similarly, the normalized BRET ratio was determined for cells co-expressing EYFP with each of the Rluc-tagged subunits. The data represent the means from six independent experiments ± S.E. p values < 0.05 indicate significant differences between Ac45-EYFP and EYFP alone control. p values < 0.05 indicate the significant differences between Ac45 mutant and wild type (WT) Ac45.

