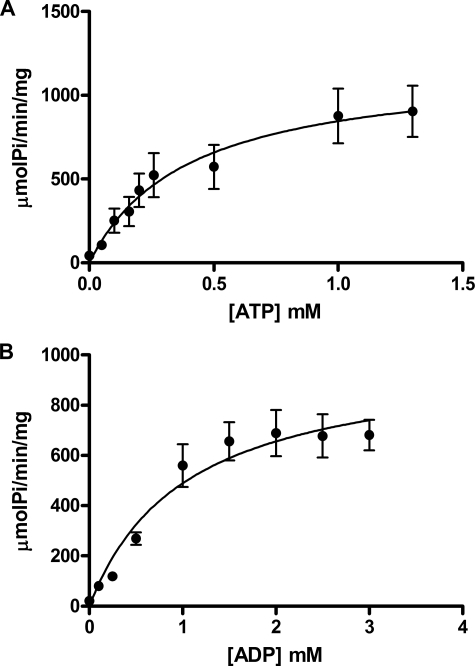
FIGURE 3.
Kinetics of purified rLpg1905. Michaelis-Menten plots of enzyme velocity demonstrating the effect of varying ATP (A) or ADP (B) concentration are shown. Curve fitting using nonlinear regression was performed using GraphPad Prism5 software. The results are expressed as μmol Pi released per min per mg protein and are the means ± standard deviations of three experiments performed in triplicate.

