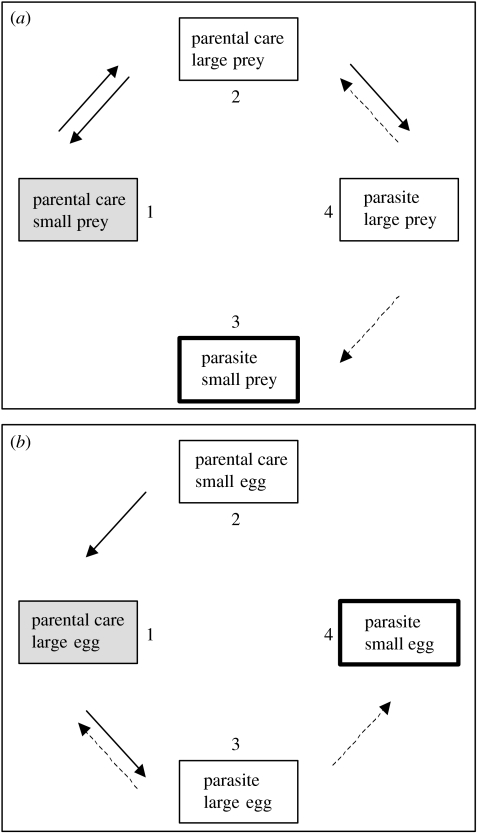
Figure 1.
Flow diagram of the most likely evolutionary pathways between cuckoo breeding strategies and prey size (a) and egg size (b). The presumed ancestral state is shaded in light grey, whereas the common current state in parasitic cuckoos is the boldly lined box. Solid arrows represent significant evolutionary pathways (p<0.05) and dashed arrows represent trends (p<0.1). Modified after Krüger & Davies (2002) and based on the phylogeny of Aragon et al. (1999).

