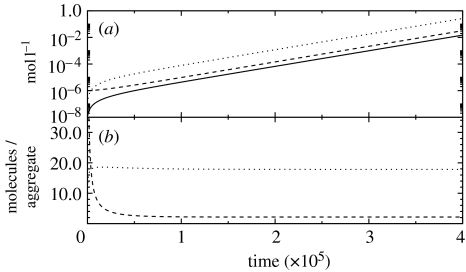
Figure 4.
A simulation of equations (5.3a)–(5.3c) with kO=5 Ms−1, kT=15 Ms−1 and the rest of parameters having the values employed in figure 2. The values of the final constants are γ0=2.5×10⁻⁴, γT=2.2×10⁻⁶ and γA=1.25×10⁻⁵. (a) [A], solid line; [Tg], dashed line and [Og], dotted line. (b) The ratio [Tg]/[A], dashed line; and [Og]/[A], dotted line.

