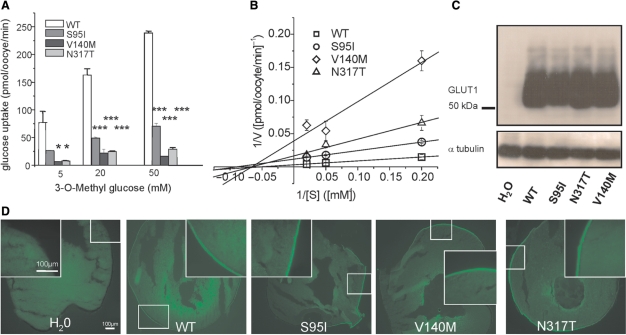
Fig. 5.
Functional studies to investigate a change in glucose uptake, protein stability or trafficking by the three point mutations in Xenopus oocytes. (A) Plotted is the glucose uptake versus 3-O-methyl-D-glucose (OMG) concentration. The uptake was significantly reduced for all three mutations (shown are representative results recorded from one batch of 3 × 10 oocytes for each glucose concentration, means ± SEM, *P < 0.05, ***P < 0.001). (B) Kinetic analysis of glucose uptakes in oocytes according to Lineweaver-Burk. The linear function 1/V (1/[S]) = 1/Vmax + Km/Vmax*1/[S] was fit to the data points, with [S] being the concentration of OMG, V the uptake velocity in pmol/oocyte/min obtained for a given [S], Vmax the maximal uptake velocity reflecting the maximal transport capacity of GLUT1 and Km the Michaelis-Menten constant representing the concentration [S] for which the half-maximal uptake velocity (V1/2) is reached. Vmax and Km were calculated from the y- and x-interceptions of the linear fits, with the y-intercept equalling 1/Vmax and the x-intercept −1/Km. The following values were obtained (Vmax is given in pmol/oocyte/min and Km in mM): WT: Vmax = 319 ± 16, Km = 19 ± 1; S95I: Vmax = 86 ± 2, Km = 11 ± 1; V140M: Vmax = 26 ± 11, Km = 15 ± 9; N317T: Vmax = 60 ± 18, Km = 15 ± 7. (C) Western blots obtained from oocytes injected with equal amounts of cRNA showed a similar amount of protein for all mutations and the WT, but no respective band for oocytes injected with H2O as a negative control; α-tubulin was used as a loading control. (D) Immunocytochemical analysis of injected oocytes using an anti-GLUT1 antibody revealed similar stainings of the surface membranes for all four clones.

