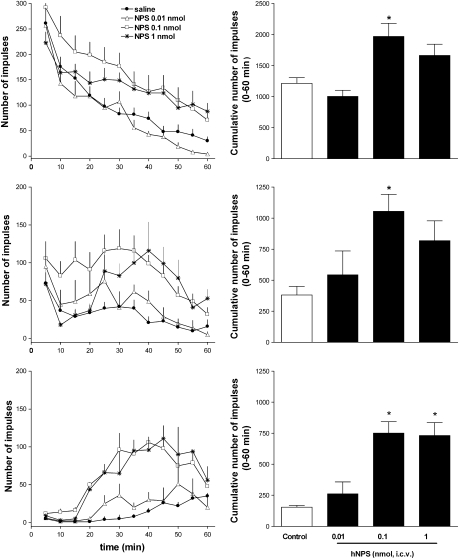
Figure 2.
Locomotor activity assay. Dose–response curve to i.c.v. injected neuropeptide S (NPS; 0.01–1 nmol) in naive (top panels), habituated (middle panels) and in diazepam-treated (bottom panels) mice. Locomotor activity of mice is displayed over the time course of the experiment in the left panels and as cumulative impulses over the 60 min observation period in the right panels. Data are mean±s.e.m. of 20 mice per group. *P<0.05 vs control, analysis of variance (ANOVA) followed by the Dunnett's test for multiple comparison.

