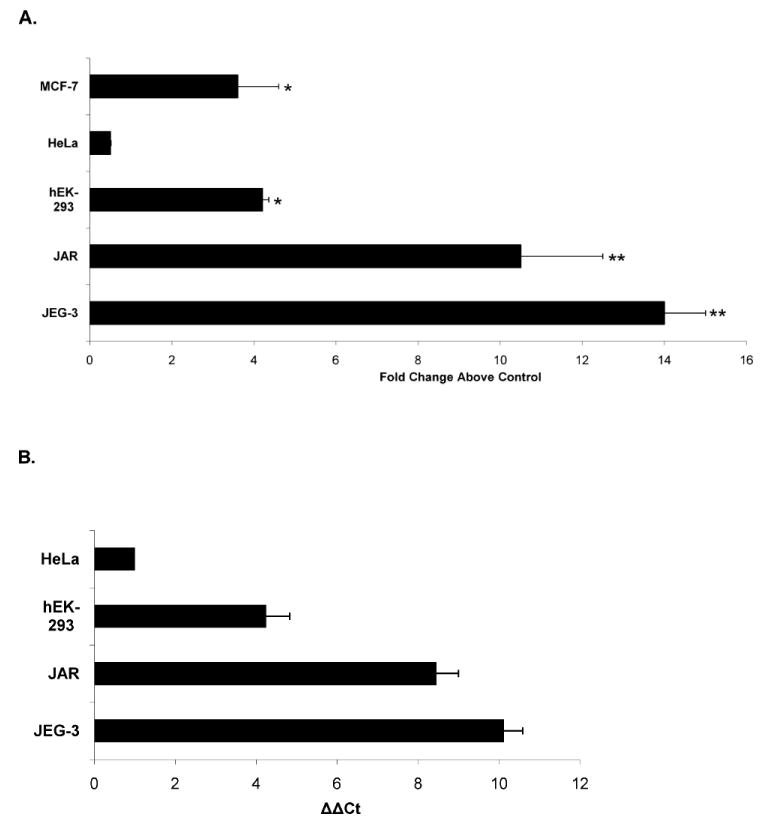
Fig. 3.

PGF promoter activity and mRNA expression are significantly lower in nontrophoblast cells than trophoblast cells. A) MCF-7, HeLa, hEK-293, JEG-3, and JAR cells were transfected with 1.5 μg of clone (−1521/+34) or 1.5 μg of control plasmid (−1521/−650opp) and 0.5 μg of pRSVLuc. Cells were processed and relative fold increase in activity above levels produced by the transfection control clone (−1521/−650opp) (set to = 1) in each cell type are shown. *, P < 0.05 comparing promoter activities produced by the −1.5-kb clone and (−1521/−650opp) control clone in each cell type. **, P < 0.005 comparison of promoter activity of the −1.5-kb clone in trophoblast cells to that produced in each nontrophoblast cell type. B) Relative PGF mRNA expression in trophoblast and nontrophoblast cell lines. Total RNA (200 ng) from each cell line was reverse transcribed into cDNA and subjected to qPCR for both PGF and RPL32 detection. ΔCT of HeLa (CTPgf-CTRPL32)-1 is used as the normalization control, and ΔΔCT of each cell type was plotted to show PGF mRNA expression level relative to that in HeLa cells. Data represents mean values (± SEM) of at least three independent measurements.
