Figure 7.
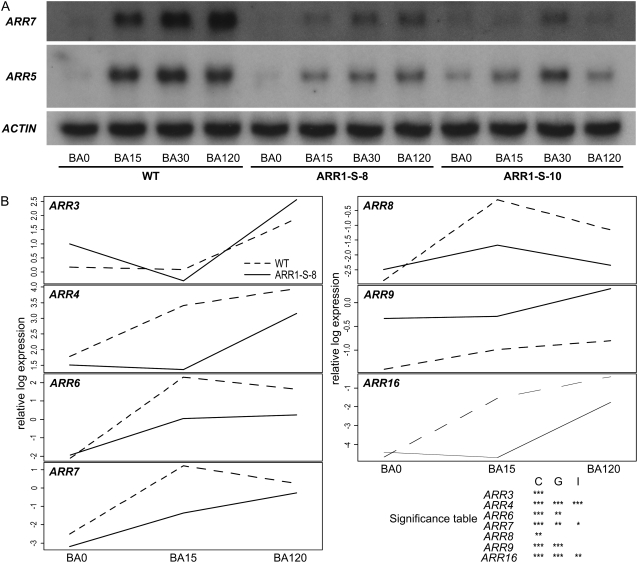
35S:ARR1-SRDX gene expression dampens the early cytokinin response. A, Northern-blot analysis of ARR5 and ARR7 transcript levels. Total RNA was isolated from 5-d-old wild-type and 35S:ARR1-SRDX seedlings before treatment and after 15, 30, and 120 min of treatment with 5 μm BA. Northern blots were hybridized with a probe specific for the cytokinin response genes ARR5 and ARR7. The ACTIN2 gene was used as a loading control. B, Interaction plots of A-type ARR genes. Interaction plots show the relative normalized expression values for all seven A-type ARR genes present on the CATMA V2.4 array plotted against the time points of cytokinin treatment: BA0 (control), BA15 (15 min of BA treatment), and BA120 (120 min of BA treatment). The table in the lower right corner shows the significance of differences in gene expression. C (cytokinin effect) represents the responsiveness of the respective gene to cytokinin treatment. G (genotype effect) denotes whether the average expression of the respective gene in line ARR1-S-8 differs significantly from that in the wild type. The cytokinin response of genes with a significant I (interaction effect) is dependent on the genotype. The significance codes are based on the uncorrected P value for each gene. Symbols are as follows: no symbol, P > 0.05; *, 0.01 < P < 0.05; **, 0.001 < P < 0.01; ***, P < 0.001.

