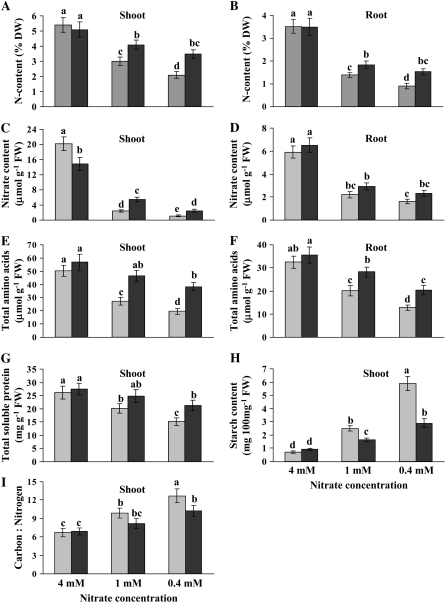
Figure 3.
Effects of different nitrate levels on N content in shoots (A) and roots (B), nitrate content in shoots (C) and roots (D), total amino acids in shoots (E) and roots (F), total soluble protein in shoots (G), starch content in shoots (H), and shoot carbon to N ratio (I) in Arabidopsis and Thellungiella plants. Experimental conditions were as described for Figure 1. Data are means ± sd (n = 3–5). Bars with different letters indicate a significant difference at P < 0.05 (Fisher's protected lsd test). Light gray bars, Arabidopsis; dark gray bars, Thellungiella Shandong ecotype. DW, Dry weight; FW, fresh weight.

