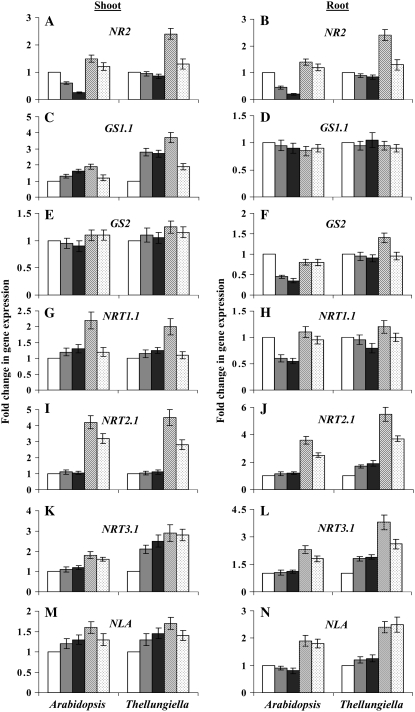
Figure 6.
Effects of different nitrate levels on the relative expression of various genes in shoots and roots of Arabidopsis and Thellungiella. Experimental conditions were as described for Figure 1, with two additional nitrate treatments: induction, switching plants 2 h before harvesting from 1 to 4 mm nitrate; reduction, switching plants 2 h before harvesting from 4 to 1 mm nitrate. Relative transcript levels were determined by real-time PCR according to Livak and Schmittgen (2001) using UBQ10 as an internal control. The gene expression for each nitrate treatment was normalized to the control level (4 mm nitrate), which was assigned a value of 1. Data are means ± sd (n = 3) and are representative of similar results from three independent experiments. Data shown are as follows: shoot (A) and root (B) NR2; shoot (C) and root (D) GS1.1; shoot (E) and root (F) GS2; shoot (G) and root (H) NRT1.1; shoot (I) and root (J) NRT2.1; shoot (K) and root (L) NRT3.1; and shoot (M) and root (N) NLA. White bars, 4 mm nitrate; light gray bars, 1 mm nitrate; dark gray bars, 0.4 mm nitrate; hatched bars, nitrate induction; dotted bars, nitrate reduction. For each part, left panel bars represent Arabidopsis and right panel bars represent Thellungiella Shandong ecotype.

