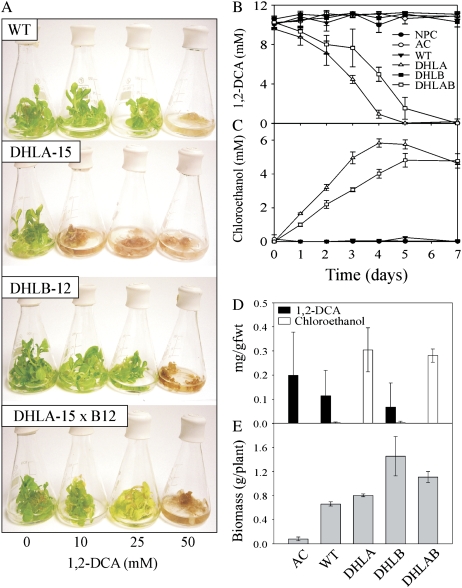
Figure 7.
Growth of wild type (WT), T3 DHLA, T3 DHLB, and F1 DHLA × DHLB lines in liquid culture in the presence of 1,2-DCA. A, Plants 5 d after exposure to 1,2-DCA. B and C, Levels of 1,2-DCA (B) and chloroethanol (C) in the media of liquid culture-grown plants dosed with 10 mm 1,2-DCA. D and E, Levels of 1,2-DCA and chloroethanol in plant tissues (D) and biomass of plants dosed with 10 mm 1,2-DCA (E). AC, Autoclaved wild type. Results are mean ± se of three replicate flasks.

