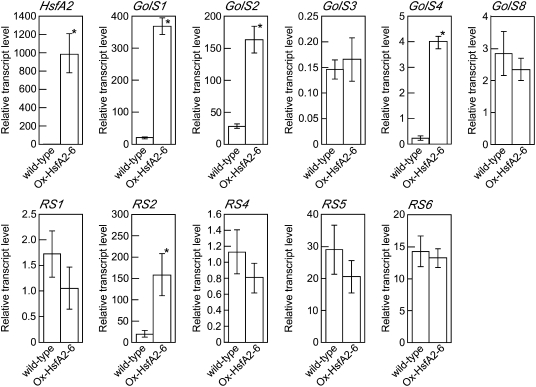
Figure 2.
Expression of the HsfA2, GolS, and RS genes in the leaves of wild-type and Ox-HsfA2 plants. Four-week-old wild-type and Ox-HsfA2-6 plants grown under control growth conditions were used for the analysis. The procedures are described in the “Materials and Methods.” Relative amounts were normalized to Actin2 mRNA (=100%). Mean ± sd values from three experiments are shown. Asterisks indicate that the values are significantly different from those in the wild-type plants (P < 0.05).

