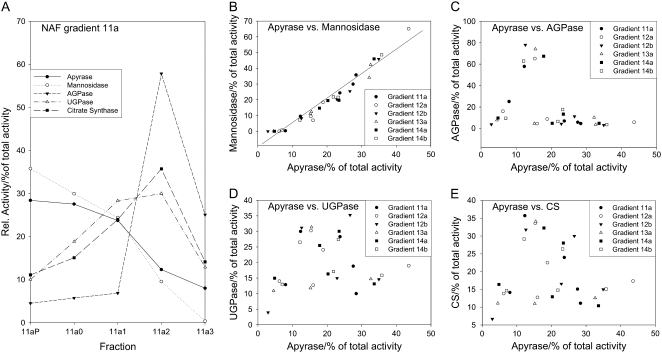
Figure 5.
Comparison of apyrase and marker enzymes in nonaqueous fractions (NAF) of lyophilized wild-type tuber tissue. A, The activities of subcellular marker enzymes and apyrase are shown along a typical gradient consisting of five fractions with increasing density from right to left. B to E, Correlations between apyrase and the markers for vacuole and apoplast (mannosidase; B), plastid (AGPase; C), cytosol (UGPase; D) and mitochondria (citrate synthase [CS]; E) were calculated from activities obtained from six individual gradients. The same nonaqueous gradients were used that were characterized previously (Tiessen et al., 2002).

