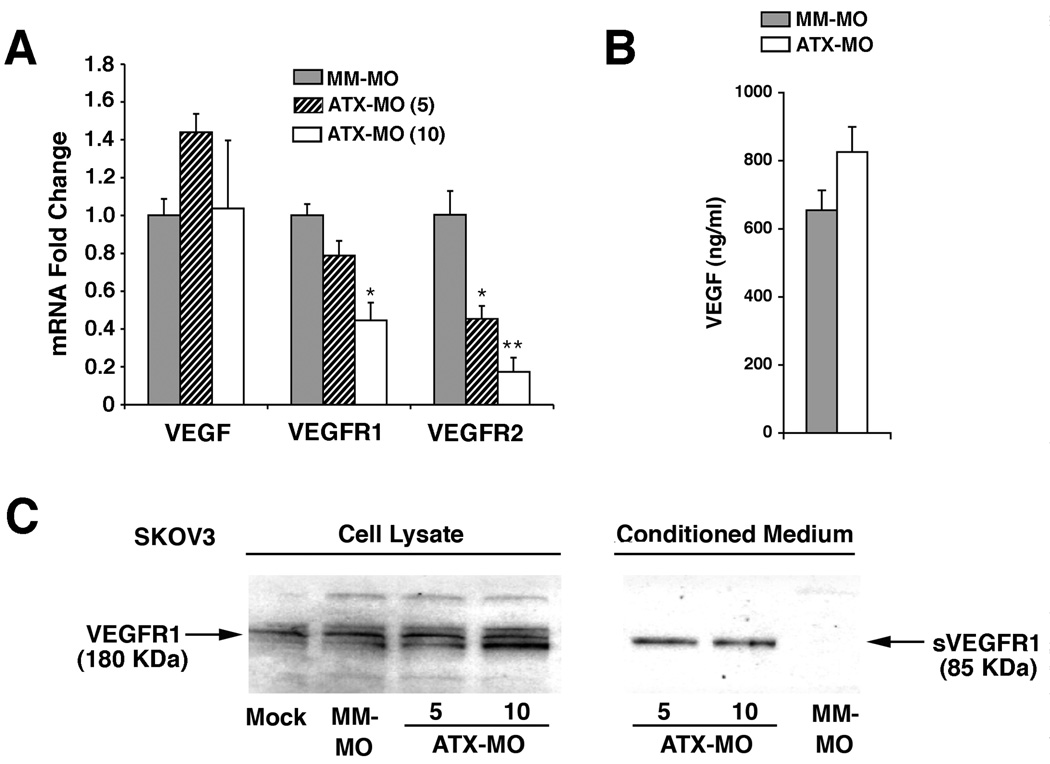
Figure 6. ATX reduction modulates expression of VEGF receptors.
(A) Quantitative RT-PCR determination of VEGF, VEGFR1, and VEGFR2 steady-state mRNA levels in SKOV3 cells are shown for ATX-specific knockdown (5 or 10 µM ATX-MO) vs. control (10 µM MM-MO). Values were adjusted to TAF9 internal control values and then expressed as fold difference ± S.D. Statistical comparisons relative to the MM-MO treatment group are shown as: **, P < 0.01; *, P < 0.05. (B) VEGF protein levels measured by ELISA in SKOV3 cell culture supernatants after ATX-MO vs. MM-MO treatment. Results are shown as Average ± SD. (C) Immunoblot analysis for VEGFR1 protein in SKOV3 cells treated as indicated from total cell lysates and cell culture supernatants. The truncated, alternatively spliced VEGFR1 product is designated sVEGFR1.

