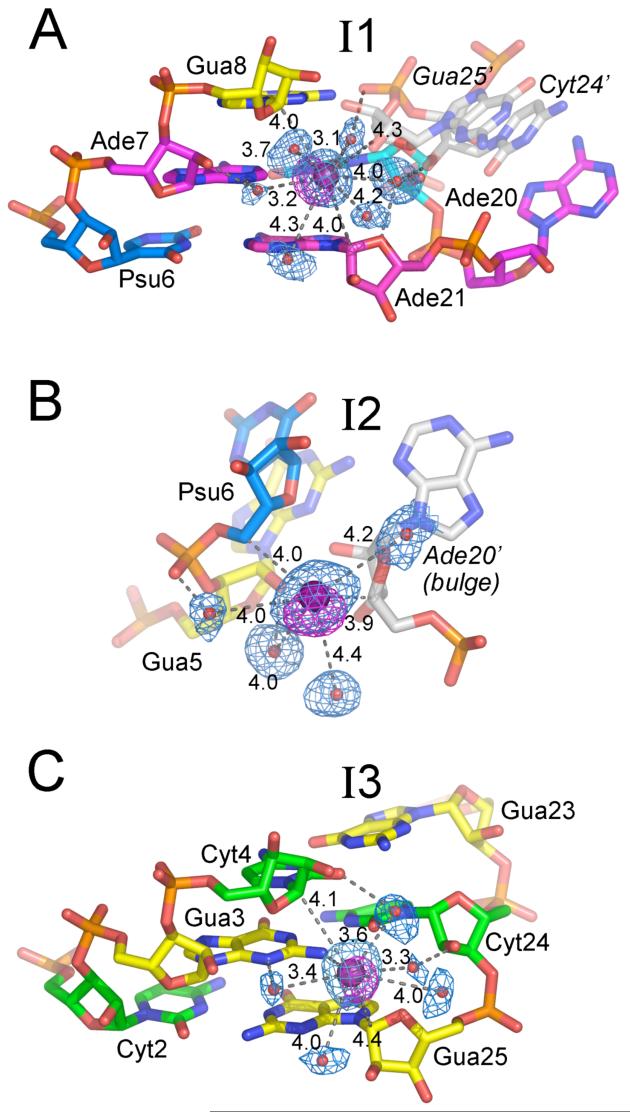
Figure 6.
Iodide binding sites of BPS1, arranged from highest to lowest anomalous electron density.(A) I1. (B) I2. (C) I3. Composite 2|Fo|-|Fc| omit electron density maps are shown in blue at 1σ contour level, and anomalous difference Fourier maps are shown in magenta at 5σ contour level surrounding the iodide ions and coordinated water molecules. Distances of direct interactions with the iodide (<4.5 Å) are given (Å). Dashed lines indicate hydrogen bonds of coordinated water molecules with the RNA (<3.0 Å). Symmetry-related moleculesare indicated by gray color and labeled with italicized, primed font.

