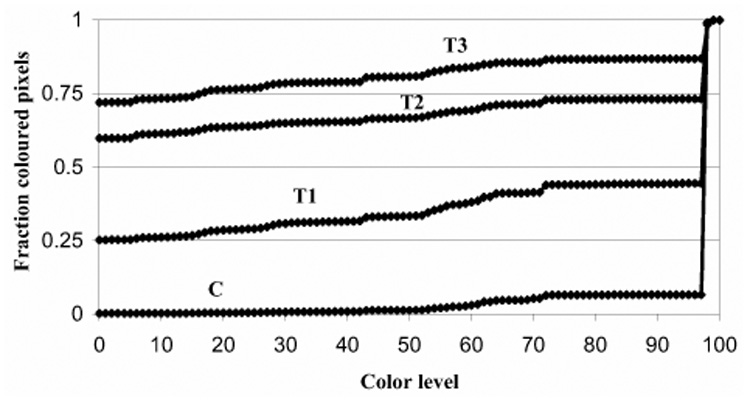
Fig. 3.

Cumulative histograms of colored pixels in power Doppler images. The number of pixels for each color level (0 = no color, 100 = most brightly colored) was measured from the contrast-enhanced power Doppler images of all murine tumors. Cumulative histogram curves were made of colored pixels in control (C) tumors, and those insonated for 1 (T1), 2 (T2) or 3 (T3) min. In the control animals, 0.94 fraction (94%) of the pixels have a high color level (exceeding color level 97), indicating the tumor is highly perfused. With increasing treatment times, the number of pixels at lower color levels increases progressively. For example, after 3-min treatment, most of the pixels have low color level values (0.72 fraction, 72%, had no color, 0.14 fraction, 14%, had color levels between 1 and 97, and 0.14 fraction, 14%, were between 98 and 100), indicating that the tumor was poorly perfused. The area above each curve measures the vascularity of the tumor, and the area below represents the extent of avascularity. The area between the curve for control (C) animals and each of the curves for treated tumors (T1, T2, T3) represents loss of tumor perfusion after insonation. The area increases progressively with treatment time. The average SD for each curve was as follows: C = ± 0.02, T1 = ± 0.33, T2 = ± 0.29, T3 = ± 0.19.
