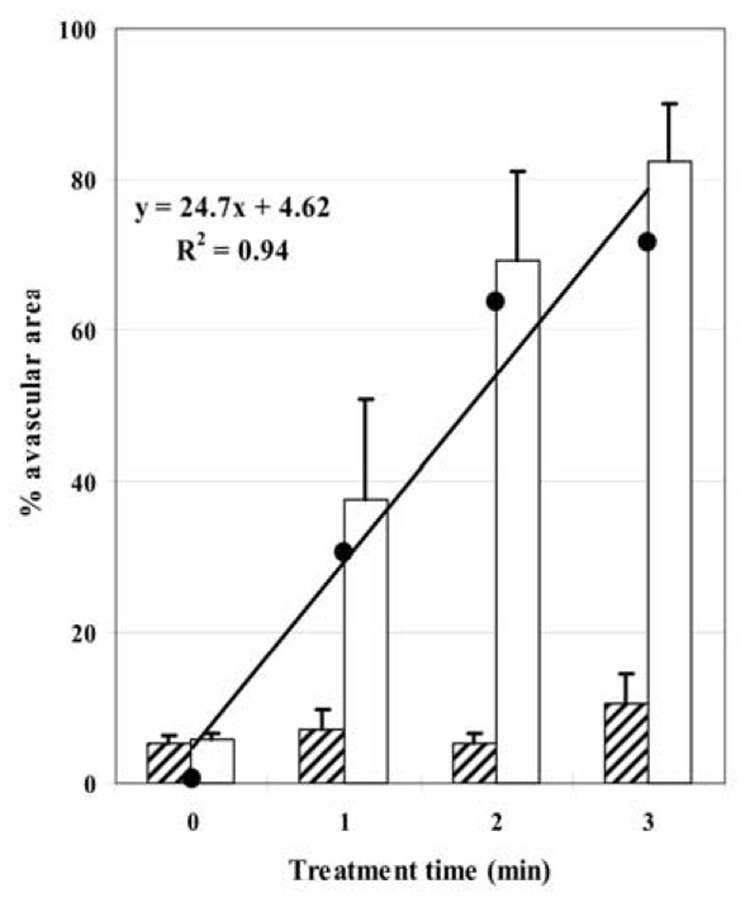
Fig. 4.
Effect of insonation on vascular perfusion in murine tumors. Hatched blocks represent mean size of avascular area before US treatment and open blocks, that after treatment; the % avascular area was measured from the areas under the cumulative histogram curves (Fig. 3; bars represent the standard error of the mean). In control animals (time = 0) there was no significant change in avascular area but, after insonation, there were highly significant increases in tumor avascularity. (●) represents the magnitude of increase in avascular area between untreated and treated groups, used to plot the linear regression. With increasing treatment time, tumors become increasingly avascular at a rate (slope of the regression line) of about 25% for each min of insonation.

