
Fig. 5.
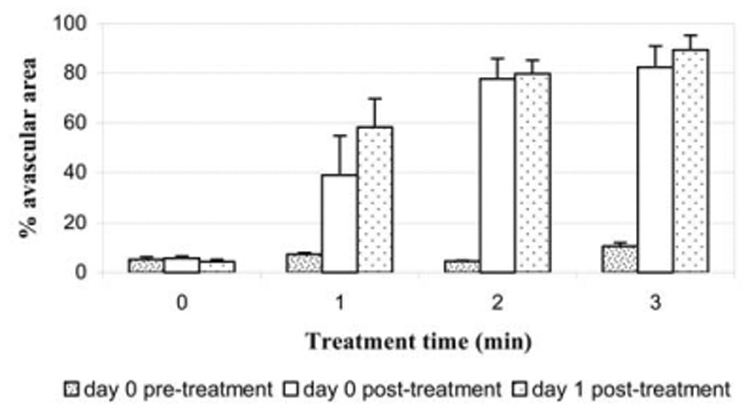
Tumor vascularity (data from all animals) before insonation, immediately after insonation and 1 day after insonation. The blocks represent the mean size of avascular area measured from cumulative histogram curves. Bars = standard error of the mean. At 1 day after insonation, the avascular area in each treated group increased compared to the avascular area immediately after insonation, but the increase was small and not statistically significant. There also was no significant change in vascularity of the control group.