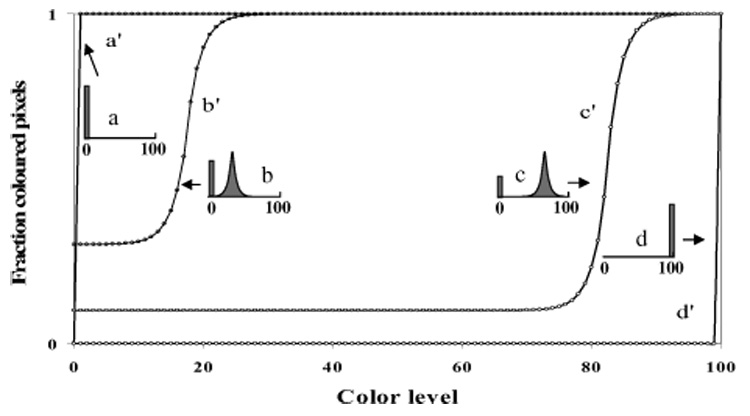
Fig. 7.

Cumulative histogram analyses of contrast-enhanced power Doppler US images, illustrating the conceptual relationships between the cumulative histograms (curves a′, b′, c′ and d′) and various corresponding normalized conventional histograms (inserts a, b, c and d).
