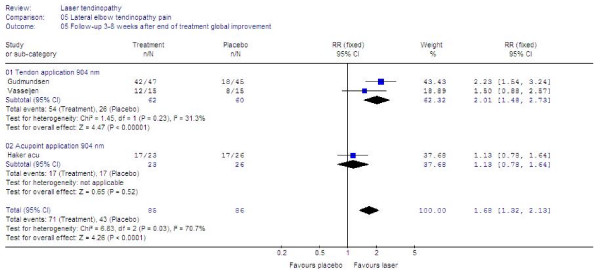
Figure 9.
Follow-up results at 3–8 weeks after the end of treatment measured as the relative risk for global improvement for LLLT compared to placebo. Trials are subgrouped by application technique and wavelengths, and combined results are shown as total at the bottom of the table. Plots on the right hand side of the middle line indicate that the LLLT effect is superior to the control treatment.

