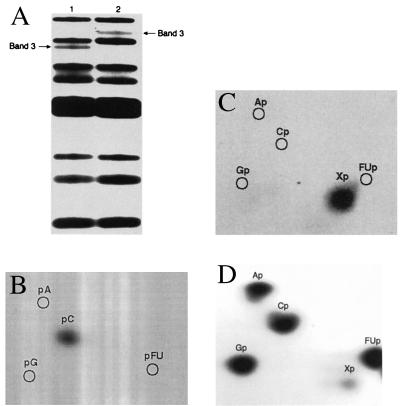
Figure 3.
3′ End-group analysis of RNase A-digested ΨSI-modified FUra-tRNA. (A) 7 M urea-25% PAGE after complete RNase A digests of [5′-32P]CMP-FUra-tRNA (lane 1) and ΨSI-modified [5′-32P]CMP-FUra-tRNA (lane 2). (B) Two-dimensional TLC of band 3, lane 2 of A after nuclease P1 digestion to 5′-NMPs. (C) Two-dimensional TLC of band 3, lane 2 of A after RNase T2 digestion to 3′-NMPs. (D) Two-dimensional TLC of RNase T2 digest of ΨSI-modified [5′-32P]CMP-FUra-tRNA. 32P bands and spots were located by autoradiography.

