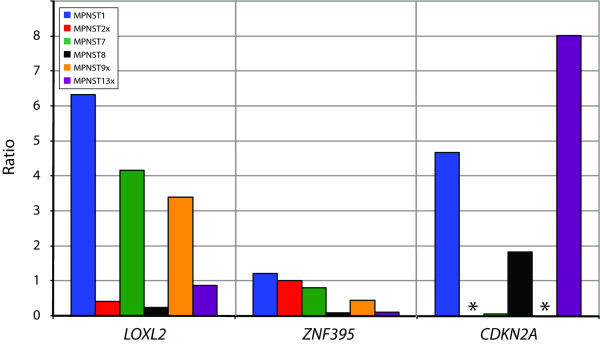
Figure 3.
Plot of expression level of three candidate target genes in six of the MPNSTs, normalized with the average expression of three endogenous controls (B2M, GAPDH and TBP). The expression level was determined relative to the average expression of two benign tumors. No detection of PCR-product is indicated with an asterisk (*).

