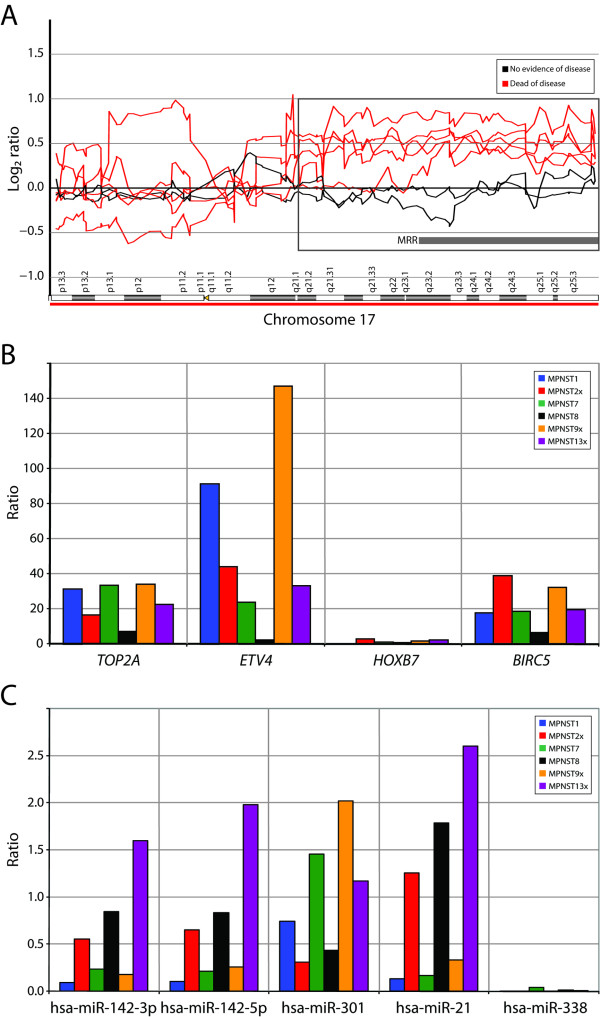
Figure 4.
(A) DNA copy number profile of chromosome 17 for seven MPNSTs. Log2 ratio for each of the genomic clones is plotted according to chromosome position using "moving average smoothing" with a three-clone window. The minimal recurrent region (MRR) gained in all five patients with poor outcome is indicated, as well as the region where at least four of the five patients showed gain (highlighted by a square). (B) Plot of expression level of four candidate target genes in 17q in six of the MPNSTs, normalized with the average expression of three endogenous controls (B2M, GAPDH and TBP). The expression level was determined relative to the average expression of two benign tumors. (C) Plot of expression level of five candidate target miRNAs in 17q in six of the MPNSTs, normalized with the average expression of two endogenous controls (RNU6B and -24). The expression level was determined relative to the average expression of two benign tumors.

