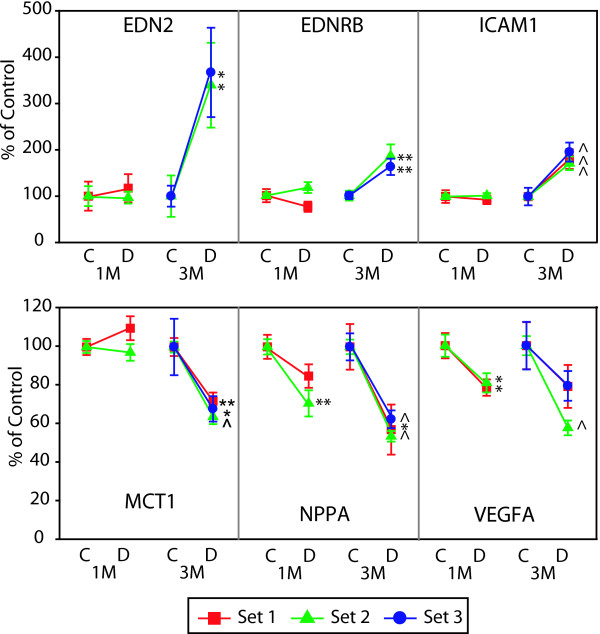
Figure 3.
qPCR confirmation of microvascular-related gene changes across multiple sets of animals. qPCR data is normalized to give mean control values of 1 and the different sets are color coded per the inset. T-test, *p < 0.05, **p < 0.01, ^p < 0.001. EDN2, endothelin 2; EDNRB, endothelin receptor type B; ICAM1, intercellular adhesion molecule 1; MCT1, monocarboxylate transporter 1; NPPA, natriuretic peptide precursor type A; VEGFA, vascular endothelial growth factor A.

