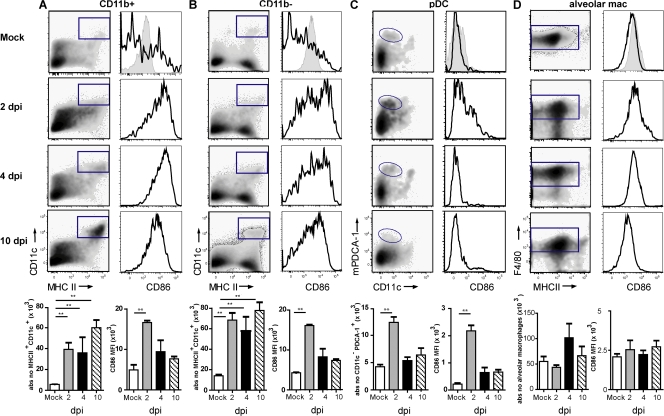
Figure 1.
Number and surface phenotype of mouse lung CD11b+ and CD11b− DCs, pDCs, and alveolar macrophages after influenza infection. Populations were gated as shown in Fig. S2 (available at http://www.jem.org/cgi/content/full/jem.20071365/DC1) and as indicated by the gates in the left column of each panel. (A) CD11b+ DCs significantly increased after infection and remained increased up to 10 dpi (left). CD86 expression was plotted in histograms (right), with MFI shown in the graph (bottom). (B) The increase in CD11b− DCs is demonstrated in flow cytometric plots (left), with absolute numbers shown in the graph (bottom). CD86 expression was up-regulated and plotted as MFI (C, bottom). pDCs increased significantly at 2 dpi and then returned to baseline. Recruitment of pDCs was accompanied by up-regulation of CD86 (right). (D) Alveolar macrophages slightly increased in number, but CD86 expression was not increased. Gray histograms represent isotype controls and were measured at 4 dpi. The values are representative of five mice per group and are expressed as mean ± SEM. Similar results were obtained from at least three separate experiments. *, P < 0.05; **, P < 0.01.

