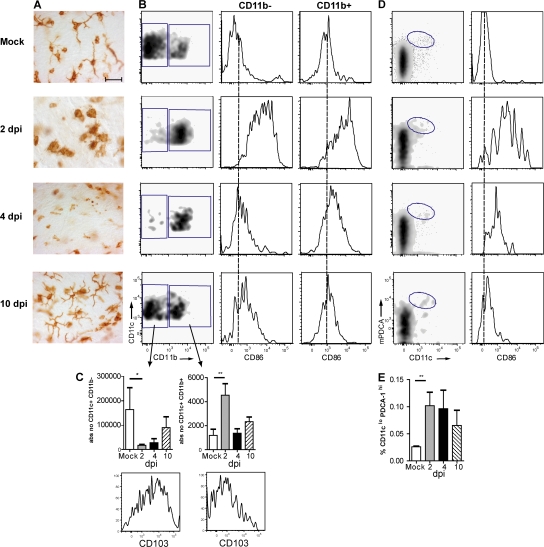
Figure 2.
DC subtypes in tracheal tissue after influenza infection. (A) Tracheal whole mount sections stained for MHCII expression were performed at various days after infection. Bar, 35 μm. (B) Flow cytometric analysis of DCs in tracheal cell suspensions stained for CD45, CD11c, CD11b, F4/80, and CD103. CD11c+ cells contained two subsets, one CD11b− and the other CD11b+. Histograms represent CD86 expression on both subsets. The dotted lines indicate MFI in a mock situation. (C) Absolute numbers of the two subsets after influenza infection expressed as mean values ± SEM. *, P < 0.05; **, P < 0.01. Histograms represent CD103 expression on both subsets. (D) pDCs were identified as CD11cintPDCA-1+ cells representing a minor percentage of CD45+ leukocytes in tracheal cell suspensions and only temporarily expressing CD86 (histogram). (E) Absolute number of pDCs at various days after infection expressed as mean values ± SEM. **, P < 0.01.

